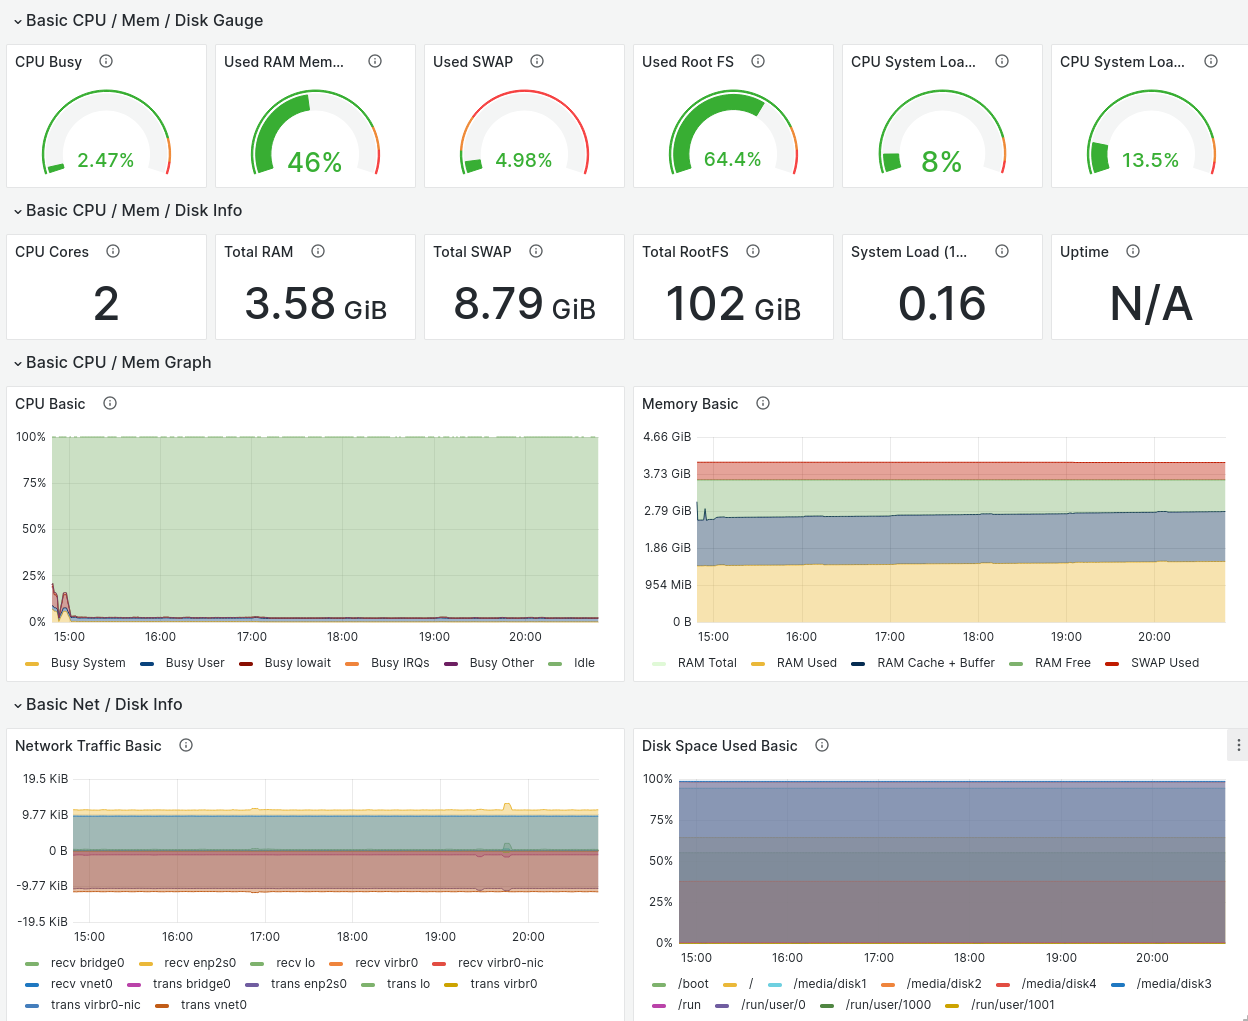
I am in the middle of upgrading my home monitoring setup. I collect metrics via prometheus and query them with grafana. More details later but yesterday I ran into a little problem that crashed one of my computers.
Part of the prometheus ecosystem is node_exporter . This is a program that runs on every computer and exports cpu, ram, disk, network and other stats of the local machine back to prometheus.
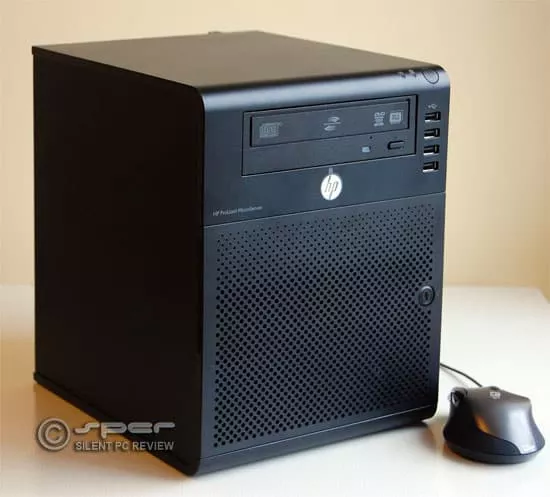
One of my servers is a little HP Microserver gen7 I bought in late-2014 and installed Centos 7 on. It has a boot drive and 4 hard drives with data on it.
I noticed this machine wasn’t showing up in the prometheus stats correctly. I logged in and checked and the version of node_exporter was very old and formatting it’s data in an obsolete way. So I download the latest version, copied it over the existing binary and restarted the service…
…and my server promptly crashes. So I reboot the server and it crashes a few seconds after the kernel starts.
Obviously the problem is with the new version of node_exporter. However node_exporter is set to start immediately after boot. So what I have to do is start Linux in “single user mode” ( which doesn’t run any services ) and edit the file that starts node_exporter and then reboot again go get the server up normally without it. I follow this guide for getting into single user mode.
After a big of googling I come across node_exporter bug 903 ( “node_exporter creating ACPI Error with Kernel error log ) which seems similar to what I was seeing. The main difference is that my machine crashed rather than just giving an error. I put that down to my machine running fairly old hardware, firmware and operating systems.
The problem seems to be a bug in HP’s hardware/firmware around some stats that the hardware exports. Since node_exporter is trying to get lots of stats from the hardware including temperature, cpu, clock and power usage it is hitting one of the dodgy interfaces and causing a crash.
The bug suggest disabling the “hwmon” check in node_exporter. I tried this but I was still getting a slightly different crash that looked like clock or cpu frequency. Rather than trying to trace further I disabled all the tests and then enabled the ones I needed one by one until the stats I wanted were populated ( except for uptime, because it turns out the time stats via –collector-time were one thing that killed it ).
So I ended up with the following command line
node_exporter --collector.disable-defaults
              --collector.filesystem
              --collector.uname
              --collector.vmstat
              --collector.meminfo
              --collector.loadavg
              --collector.diskstats
              --collector.cpu
              --collector.netstat
              --collector.netdev
which appears to work reliably.